This page is outdated. Get the latest User’s Guide.
===================
Here are some guidelines to get you started.
Using the Tester is straightforward. To run tests, you need to define a trading strategy and select the test data.
Trading Strategy. It is defined as C++ code. You can load (write) and compile a strategy on the Strategy tab. On start-up, the Tester shows an inbuilt example strategy, marked as [internal]. You can also load a sample 3 RSI- based strategy that is provided on the Tester’s download page. Use Open button to load it:
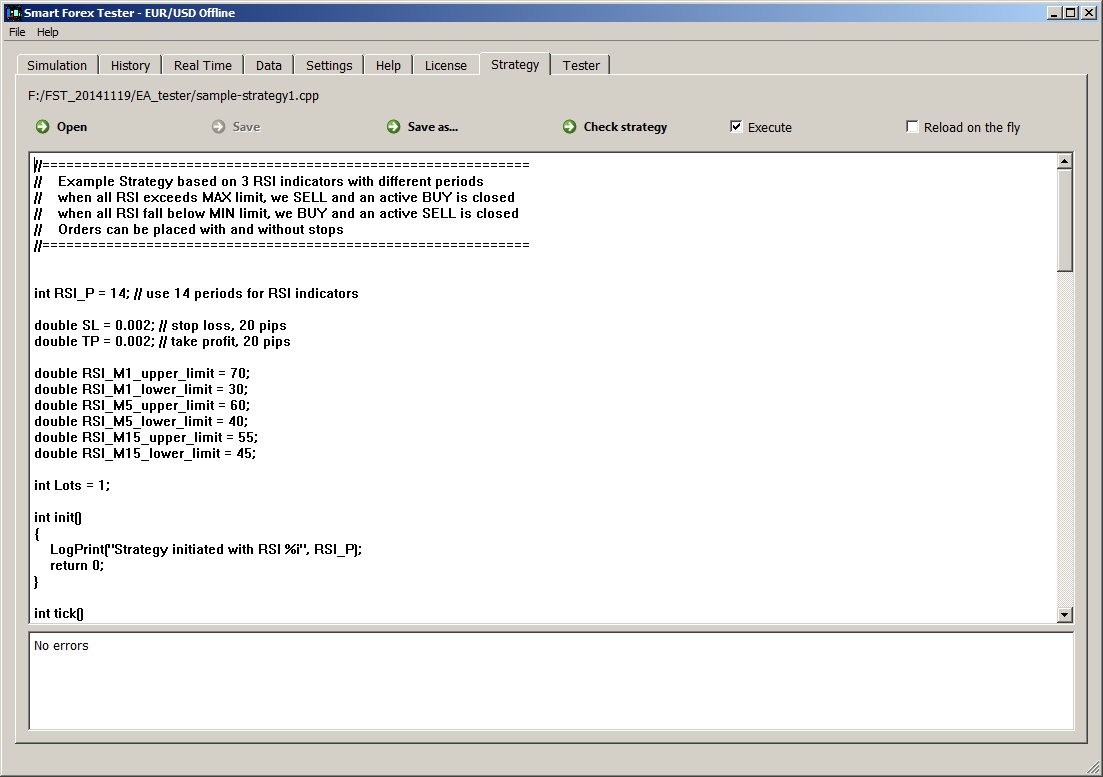
Now, you need to compile the strategy by clicking Check Strategy button. If there are compilation errors, check them in the bottom window. When no errors, check Execute box. Now the strategy is ready for use.
Test data. Data feed options are exactly the same as in the Simulator. (See the details in the Simulator User’s Guide).
For real time (forward) testing, go to the Real time tab, select a currency pair and click Start simulation button.
For backtesting, go to the Data tab, and load the price quotes from a .csv file.
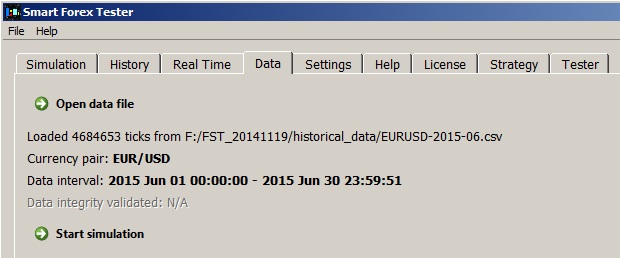
Then select the start date/time and you can start simulation from the same tab. Alternatively, you can go to the Tester tab and start the test from there by pressing Start button.
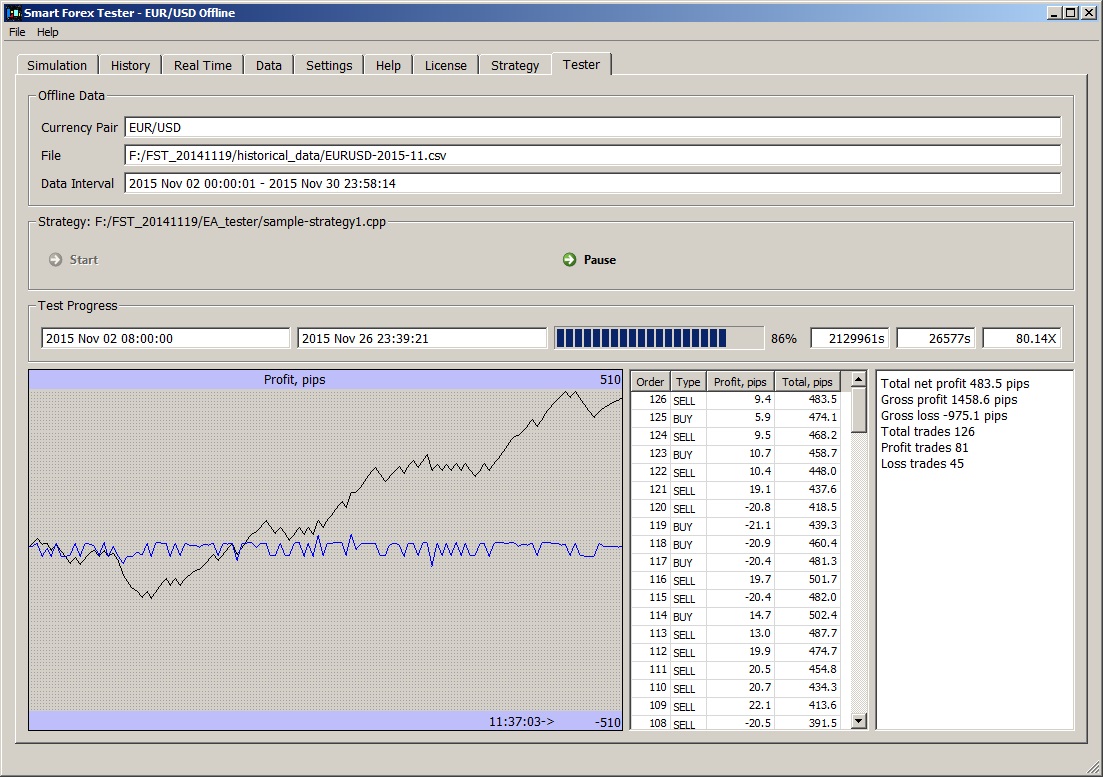
On the Tester tab you can monitor the overall test result. You can pause the test there and go to the Simulation tab to review the trades, then resume.
NOTE: If you test on the real-time data, pressing the Pause button turns on Timeshift mode – the Tester will start recording the live data feed. Next press will switch the Tester to the Play mode (See the details on how Timeshift works in the Simulator User’s Guide).
All Simulator’s functionality is available during the test – you can, e.g. manually close the trade placed by the strategy.
You can make changes to the strategy manually from the GUI or upload another one. A changed strategy needs to be recompiled, as described above.
You can apply the changes without restarting the running test. For that, check the box Reload on the fly.
Trade and market analysis. At any time, you can zoom in any graph on the Simulation tab. For that, select a rectangular area by clicking and holding the left mouse button on the left border and releasing it on the right border.
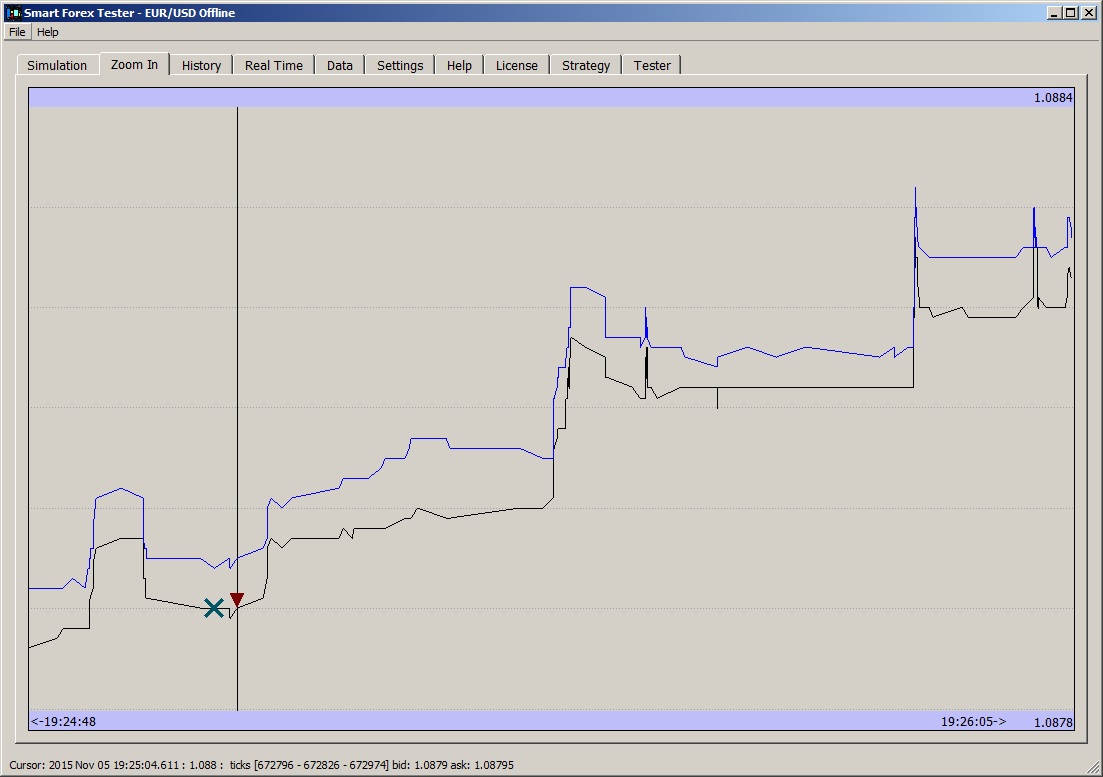
The Tester will show the selected area on the Zoom In tab.
On this tab, you can continue zooming in exactly the same way as described above. To zoom out, use the left click. Double left click will return you to the Simulation tab immediately.
You can also move the graph as a whole by clicking and holding the right button.
The vertical line helps you find the price quotes and trades. All the information is shown in the status line in the bottom.
For example, on the graph above, we put the vertical line on the sell trade symbol. We see the trade happened at the tick # 672826, with bid 1.0879 and ask 1.08795. Other number in square brackets show the ticks interval that is currently plotted. You can also see that this test was run for offline data for November 2015.